PowerGuard Commercial Range User Manual v1.5


PowerGuard Commercial Range User Manual
Version number: 1.5
Mr. Johan Theron
General contact: [email protected]
082 788 1615
Technical contact: [email protected]
083 600 1827
Address: PO Box 39521
Capricorn Square
7948
Cape Town
Table of Contents
1. PowerGuard unit operation 3
1.3 Settings on the PowerGuard Controller 5
1.4 Settings on PowerGuard Receivers 7
1.5 LED light codes / meanings 7
2.3 How to view & interpret graphs 11
2.4 How to view & interpret the dashboard 12
2.5 Estimated monthly savings 14
Appendix A. Front face of PowerGuard CPM30-1W Single Channel Receiver 17
Appendix B. Front face of CPM16-30 16-Channel Receiver 18
1. PowerGuard unit operation
The PowerGuard system is fully automated and has been designed to require no user intervention.
1.1 System operation
The below simplified diagram shows how the PowerGuard system is connected to a facility’s electrical system.
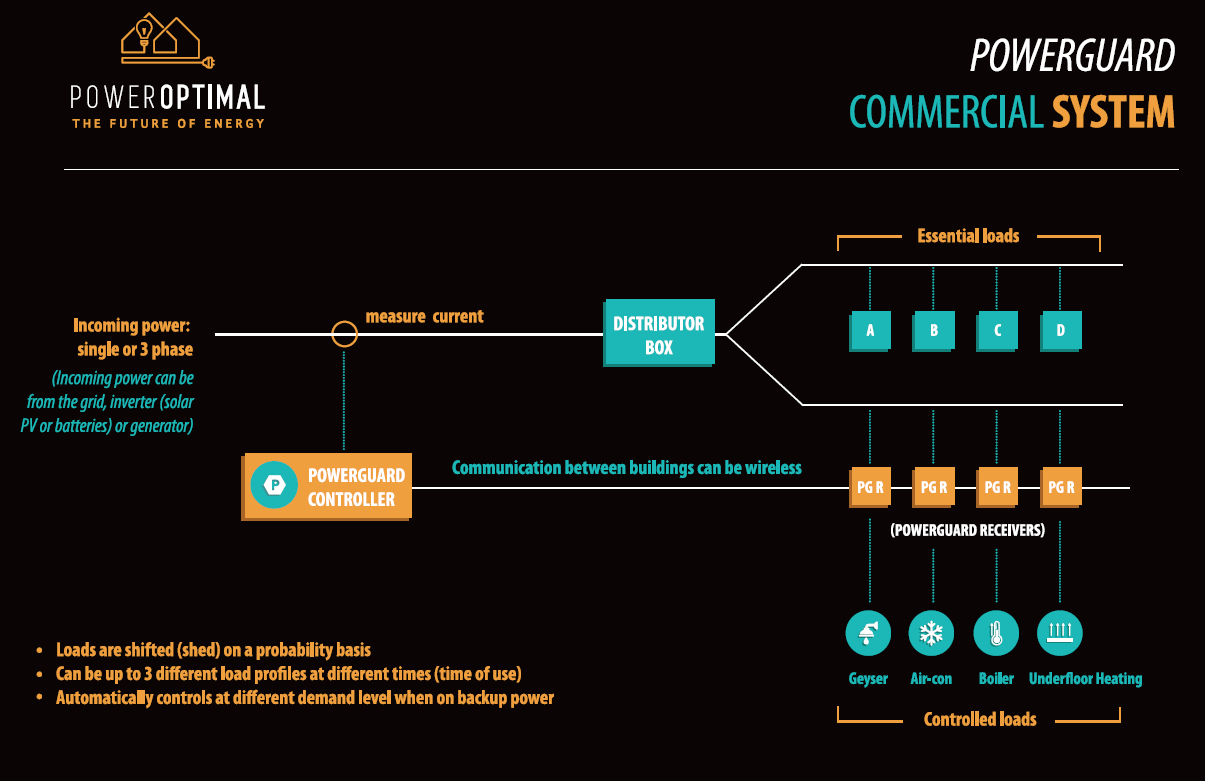
The PowerGuard Controller measures the total incoming current using current transformers installed on the incoming power line(s) (either single phase or 3 phase). It also measures the average voltage on the incoming power line(s).
Based on the measured current and voltage values, the Controller calculates the power demand (in kVA) for the facility. This value (total power demand of the facility) is displayed on the LCD screen.
a. Normal operation
Based on the preset control level, the PowerGuard Controller will start sending out shed requests to all the Receivers (PG R in the diagram). Each Receiver has its own pre-set settings that determine how it will respond to the controller – specifically, how regularly it should switch off (probability of responding), for how long it should switch off, and for how long after a previous switch-off it should not switch off again (see Section 1.4).
The Controller will continue to send shed requests until the power demand stabilises at a level below the control level.
This simple configuration allows a lot of flexibility in how the facility can be managed, and effectively distributes switch-off of loads across the facility in a balanced manner. (However, it is not necessary to change ANY settings once the system has been commissioned and configured by PowerOptimal. The overall control level can be changed if there are substantial changes to occupancy or circumstances, but no other settings need to be changed.)
The facility can be controlled either at a maximum current value (A) or a maximum demand value (kVA). This setting is found on the Controller (see Section 1.3). Whether it is controlled at maximum current value or maximum demand value is determined by the main purpose of the system – i.e. is it to (i) alleviate power supply constraints, or (ii) reduce demand charges. Note: this setting is typically only configured once (during installation) by PowerOptimal, and there is no need to change it.
(i) Power supply constraints – control at maximum current (A)
If the facility has power supply constraints (e.g. experiencing power trips), control at a maximum current value is more suitable, since loads will then only be shed on the phase that requires reduction in current to avoid power trips. The online monitoring system can be used to determine whether load balancing across the phases can be improved – e.g. if one notes that a specific phase is the main or only cause of shedding, loads can be moved from that phase to another phase.
(ii) Reducing demand charges – control at maximum demand (kVA)
When demand charge (electricity cost) reduction is the main purpose of the system, then it is better to control the facility’s power use on a maximum demand (kVA) basis, since this is what demand charges are calculated on by the utility / municipality.
b. Time of use settings
The system can be configured to manage at three different control levels based on input from timers: ‘normal’, and two time of use settings. It can also be configured to completely switch off all loads at certain times. Please speak to a PowerOptimal representative if you wish to implement any of these settings. It will require installation of one or more timers.
c. Backup power setting
The system can be configured to automatically detect when there is a switch to backup power, and to manage at a different control level on backup power. Please speak to a PowerOptimal representative if you wish to configure the system for backup power management.
d. Power failures
When power returns after a power failure, the system will wait four minutes for the power to stabilise, and then it will systematically switch on the loads in a staggered manner, in order to avoid the cold pick-up power demand spike.
All controlled loads are protected against under- and overvoltage, and will be switched off should such an event occur.
1.2 LCD screen readout
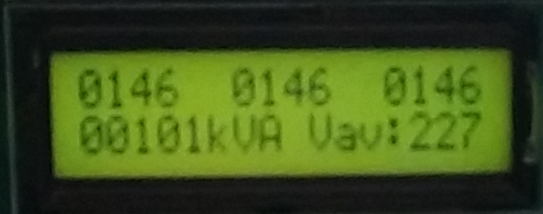
Current – White line (A)
Total demand (kVA)
Current – Red line (A)
Current – Blue line (A)
Average voltage (V)
1.3 Settings on the PowerGuard Controller
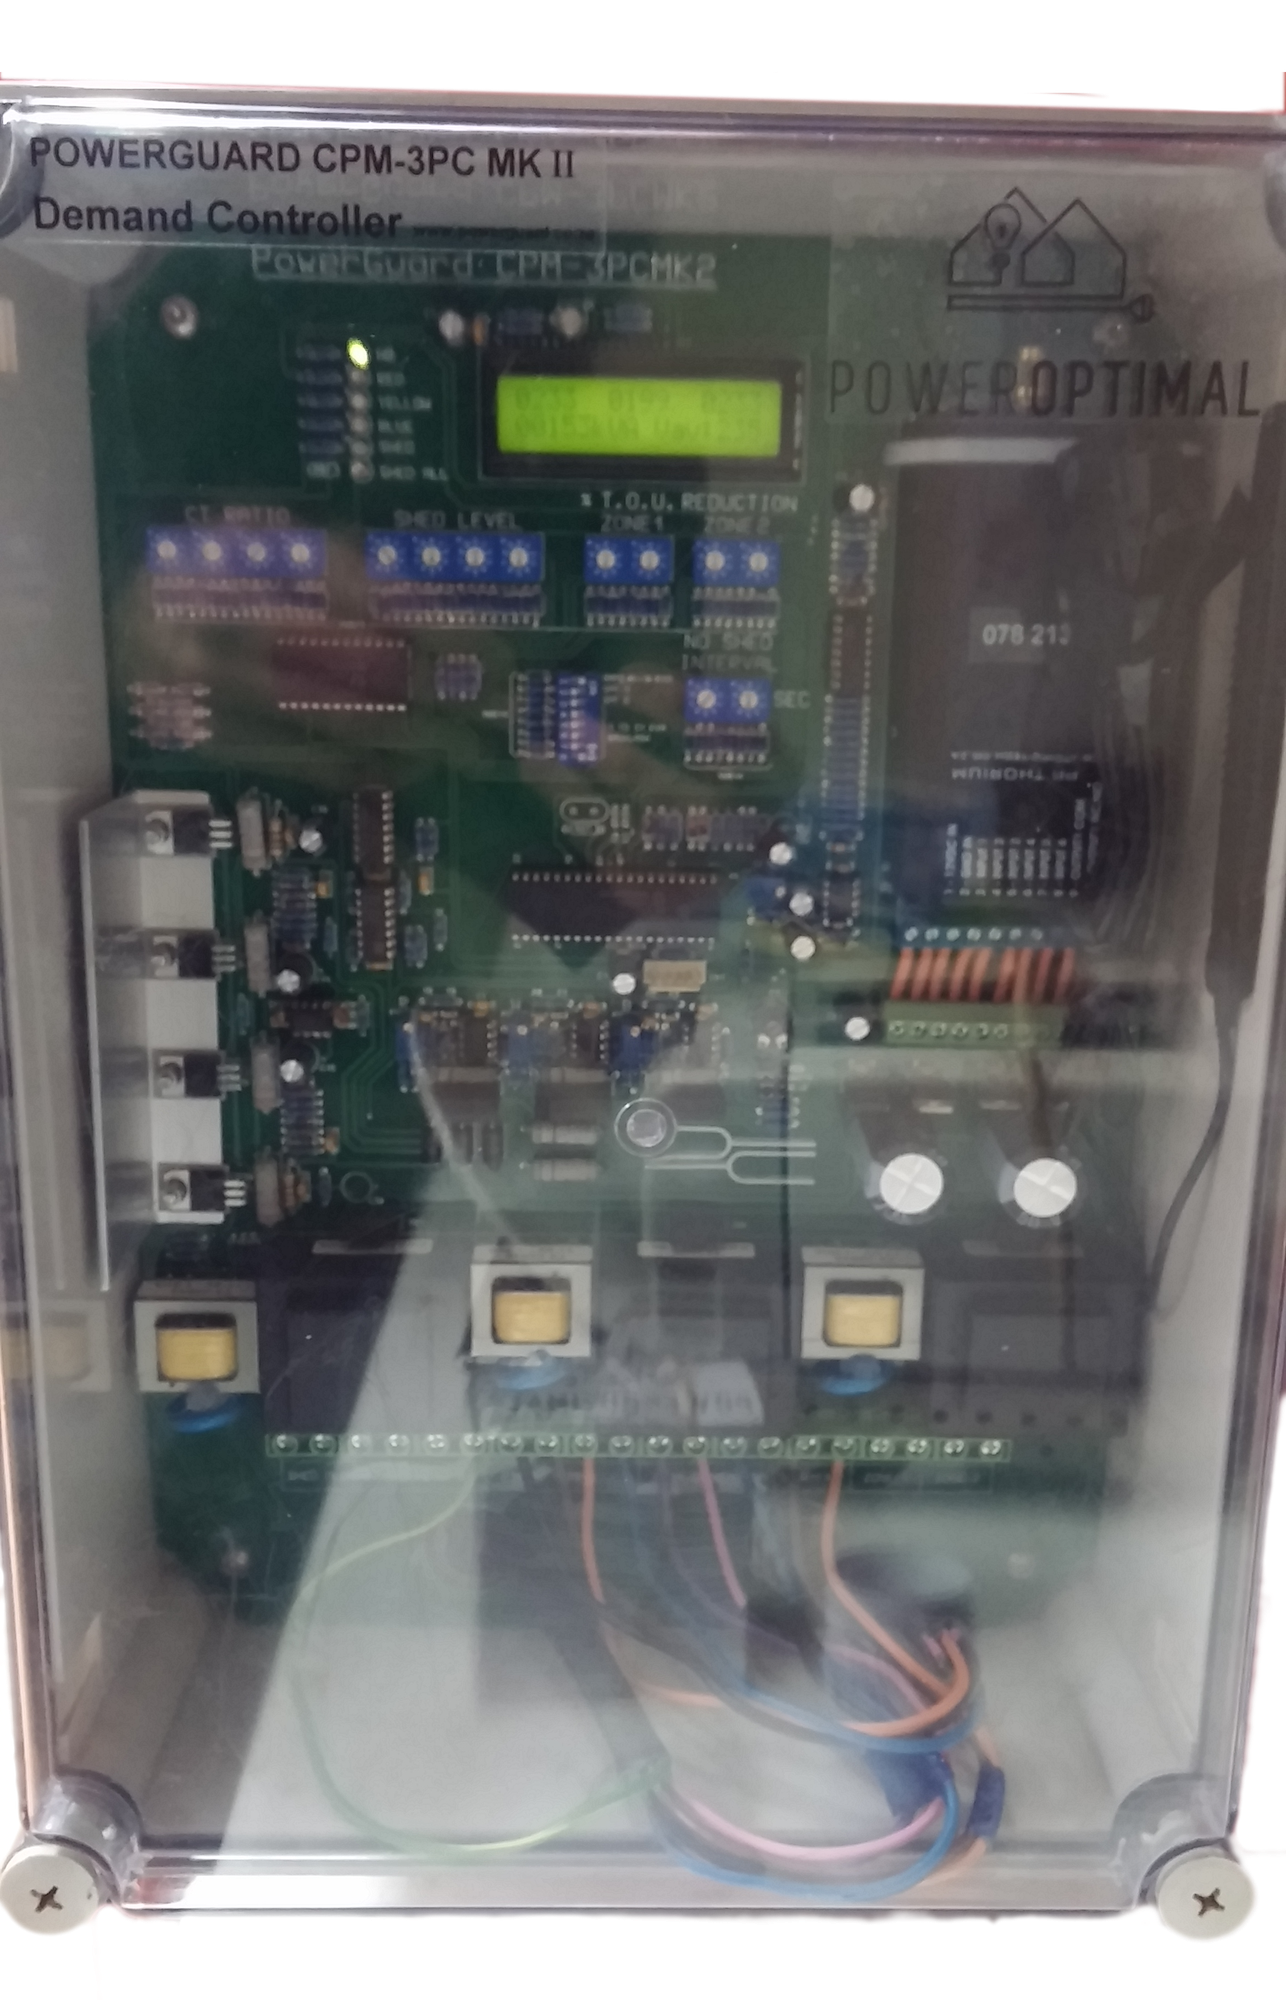
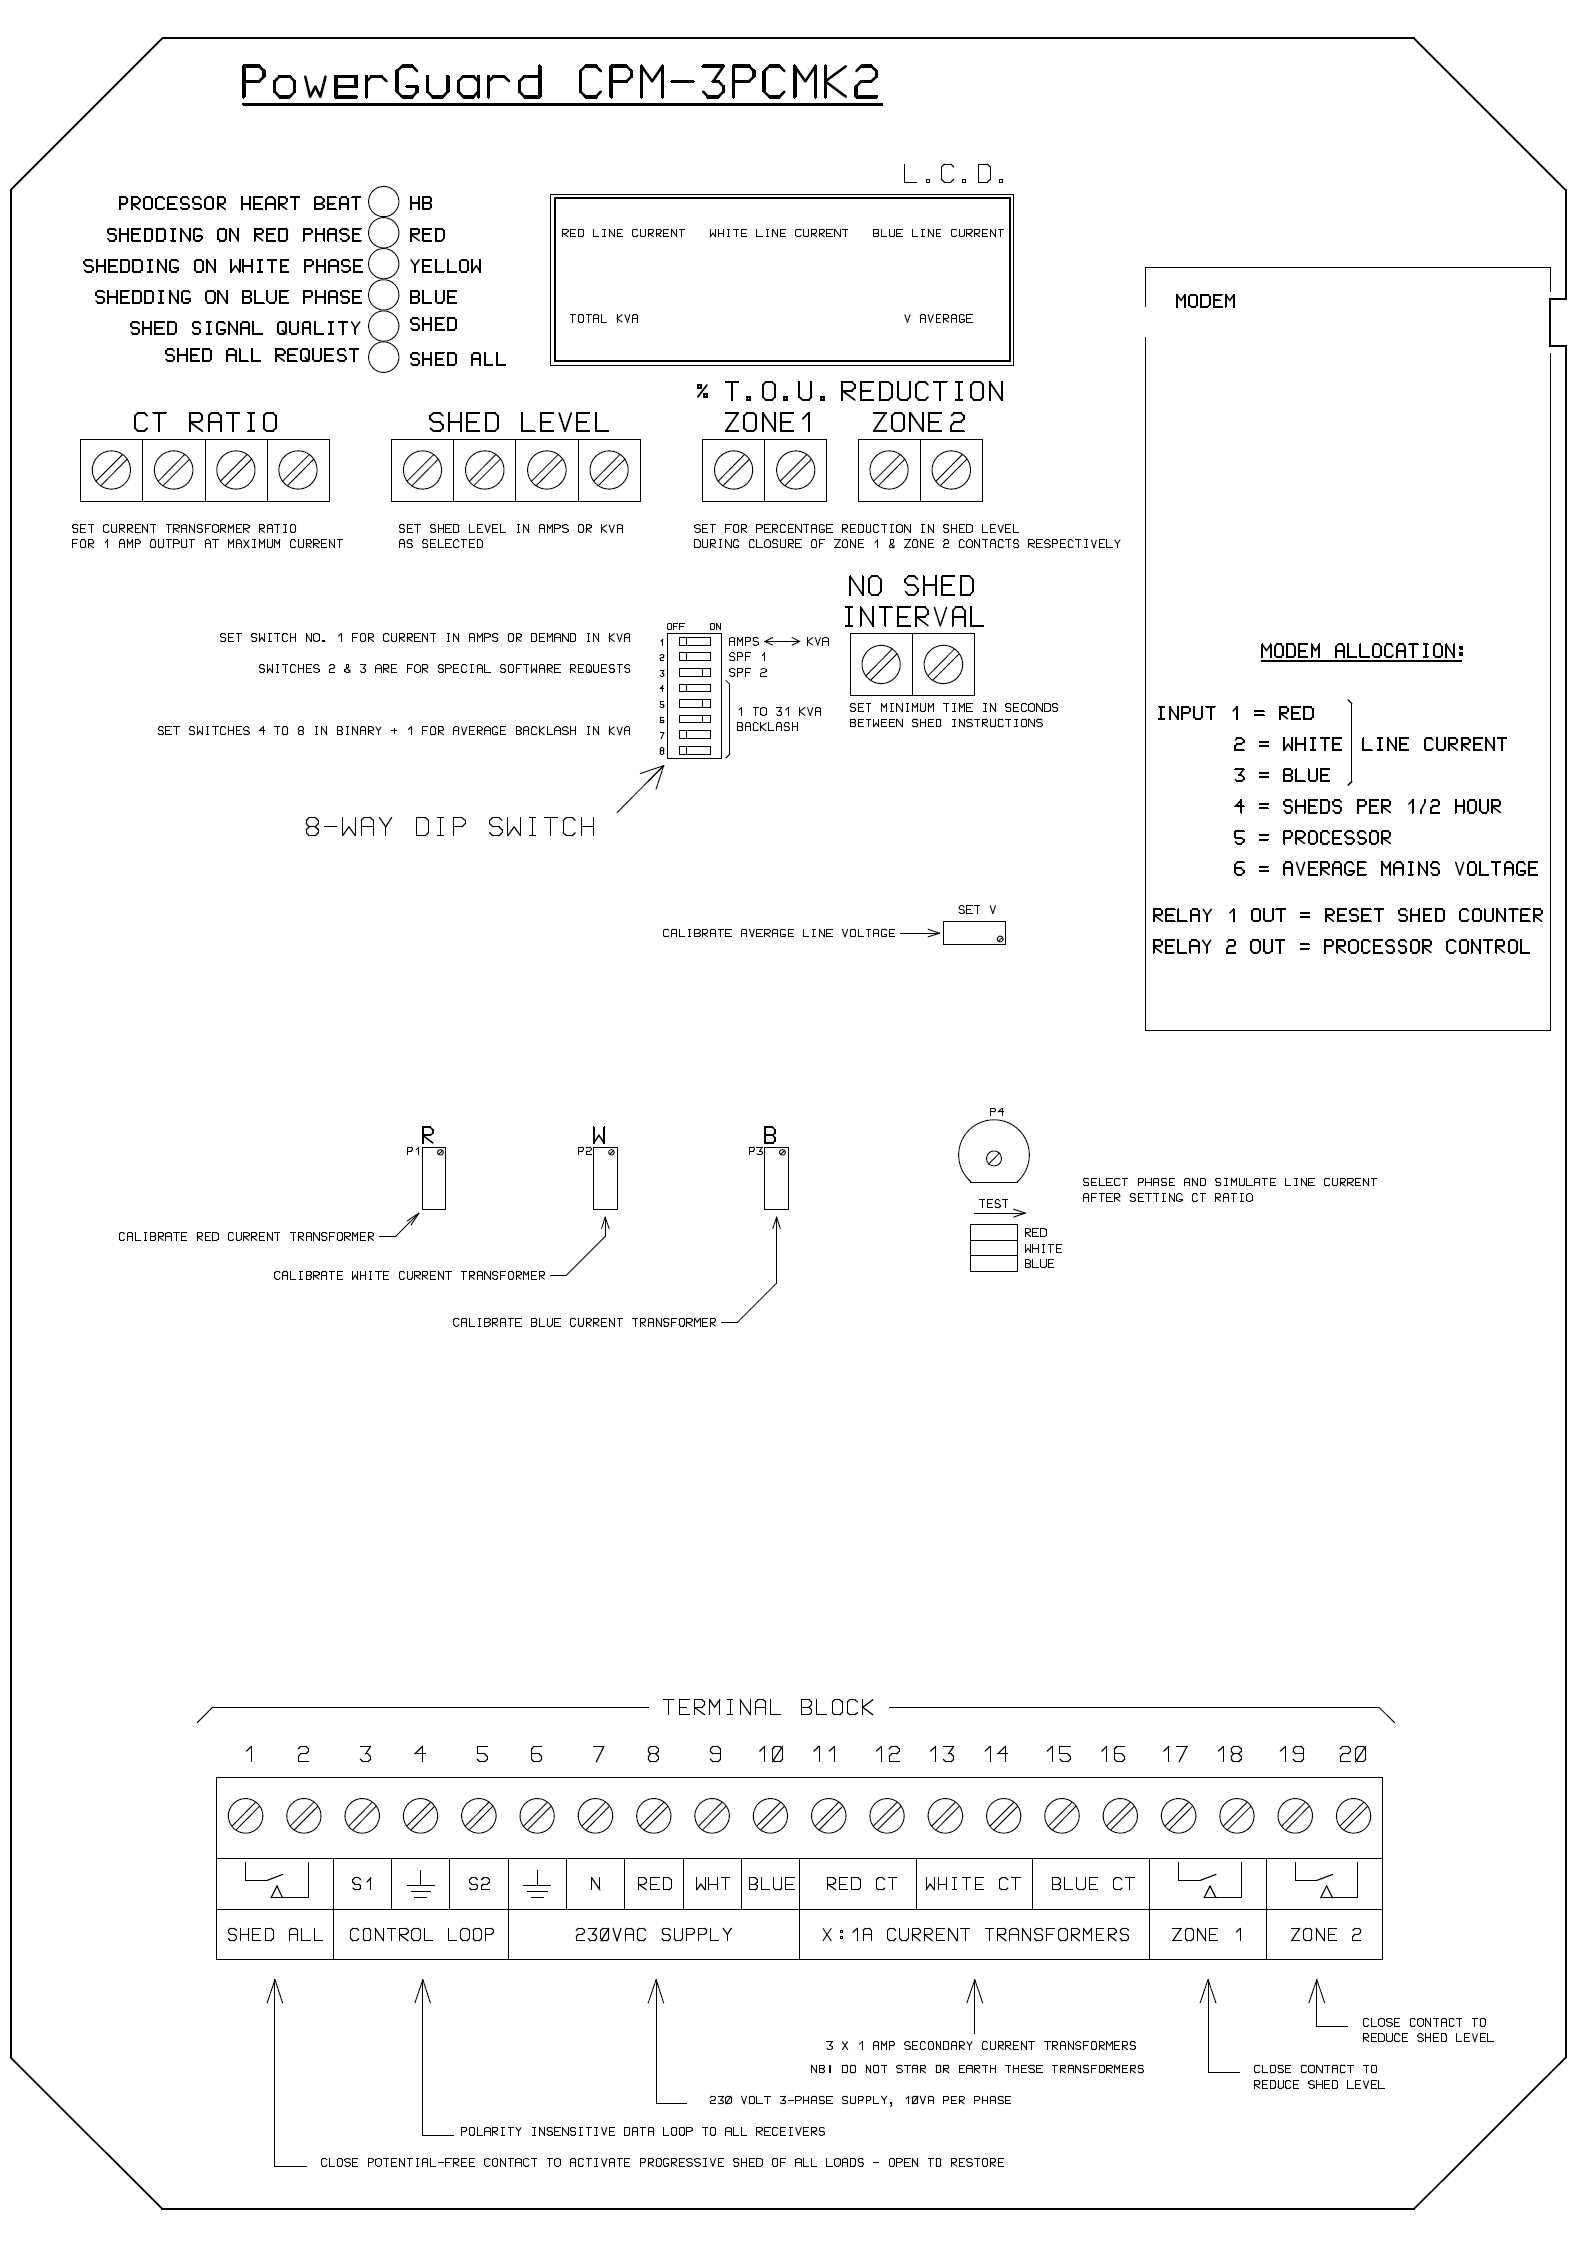
On the next page is the front face of the PowerGuard Controller.
The only setting that should be changed by the user under normal circumstances is the Shed Level (circled in red). Just turn the dials with a screwdriver to select the control level. The numbers read as one would a normal number (e.g. dial settings 0 – 1 – 0 – 5 would be 105 kVA or amps).
The other settings are configured during installation & commissioning and should not be altered.
1.4 Settings on PowerGuard Receivers
See Annexure A for the front face of the CPM30-1W receiver and Annexure B for the front face of the CPM16-30 receiver. No settings should be or need to be changed by the user.
1.5 LED light codes / meanings
Controller
The following LED lights are present on the PowerGuard Controller for monitoring and diagnostic purposes:
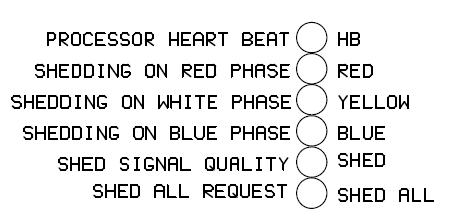
The LED lights have the following meanings:
|
|
| ||
|
|
| ||
|
|
|
|
|
|
|
|
|
|
|
|
|
|
|
|
|
|
|
|
|
|
|
|
|
|
|
|
|
|
Receiver
The PowerGuard Single Channel Receiver (CPM30-1W) has a single small light window on the front of the cover for diagnostic purposes. The light position is indicated below.
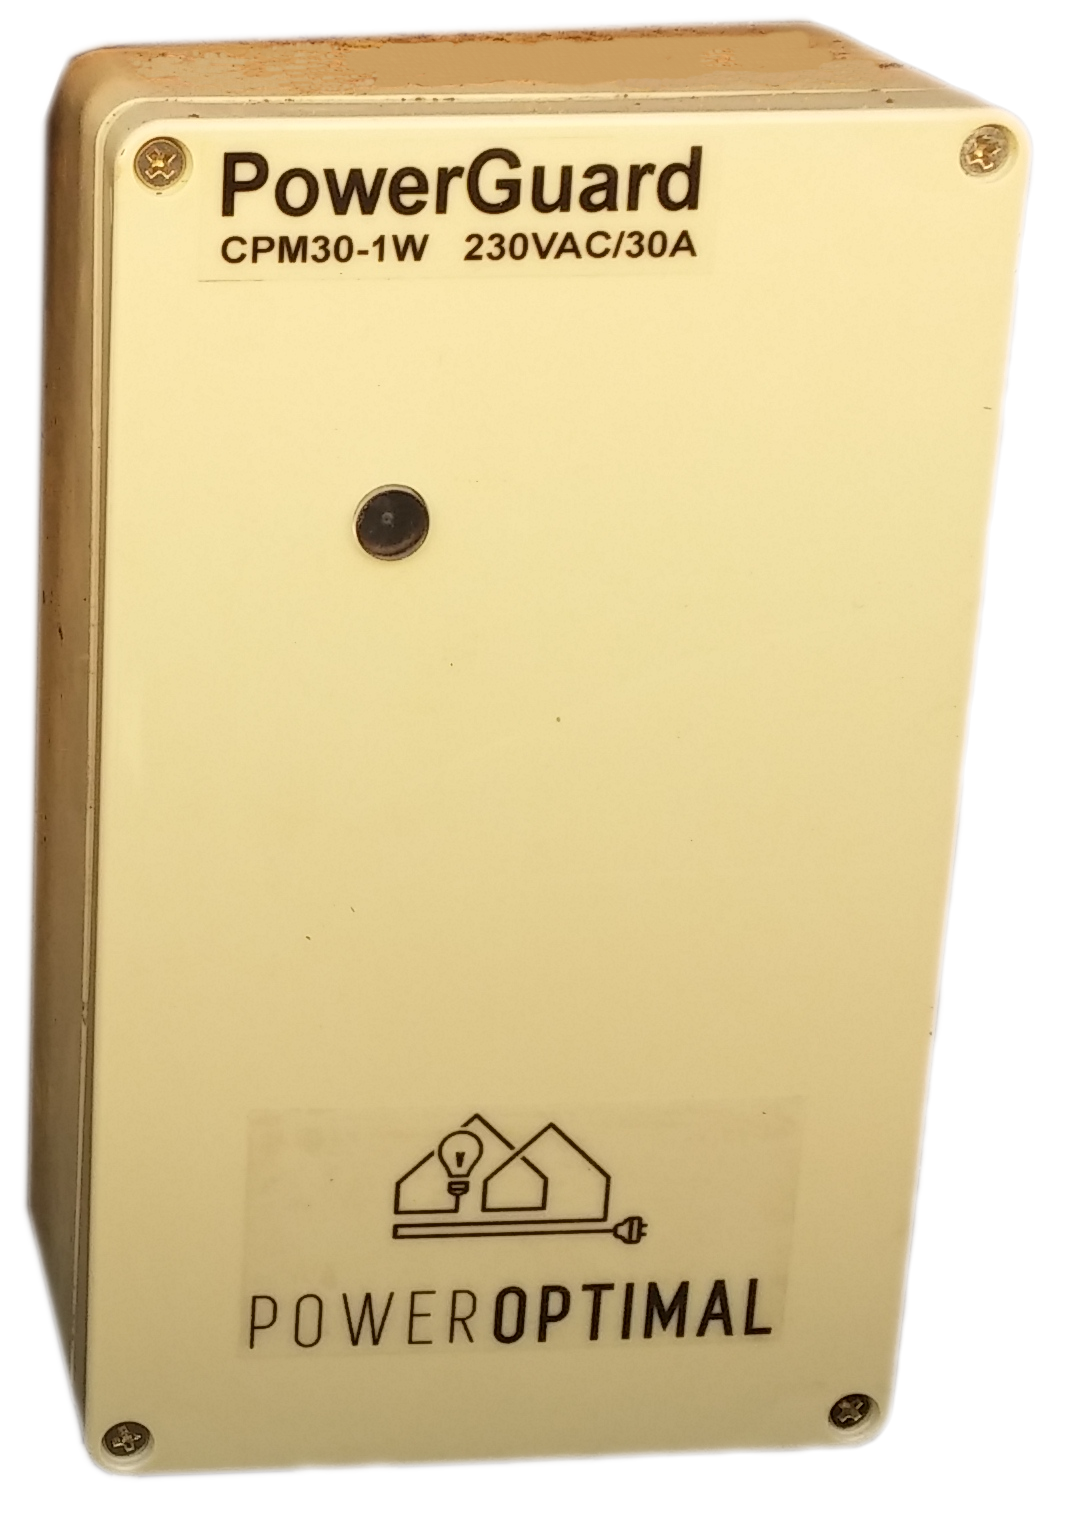
Indicator light window
The indicator light window indicates the following:
|
|
|
|
|
|
|
|
2. Online monitoring
The PowerGuard system has a built-in modem and sends measurements to the PowerOptimal database every half hour. The database is accessible via Energy Cybernetics’ Powerwatch front-end.
2.1 How to log in
Go to:www.cpowerwatch.comClick on the “Sign In” button at the top right of the screen.Enter your username and password as provided during installation.
2.2 Landing page
Upon login, you should see a screen similar to the below:
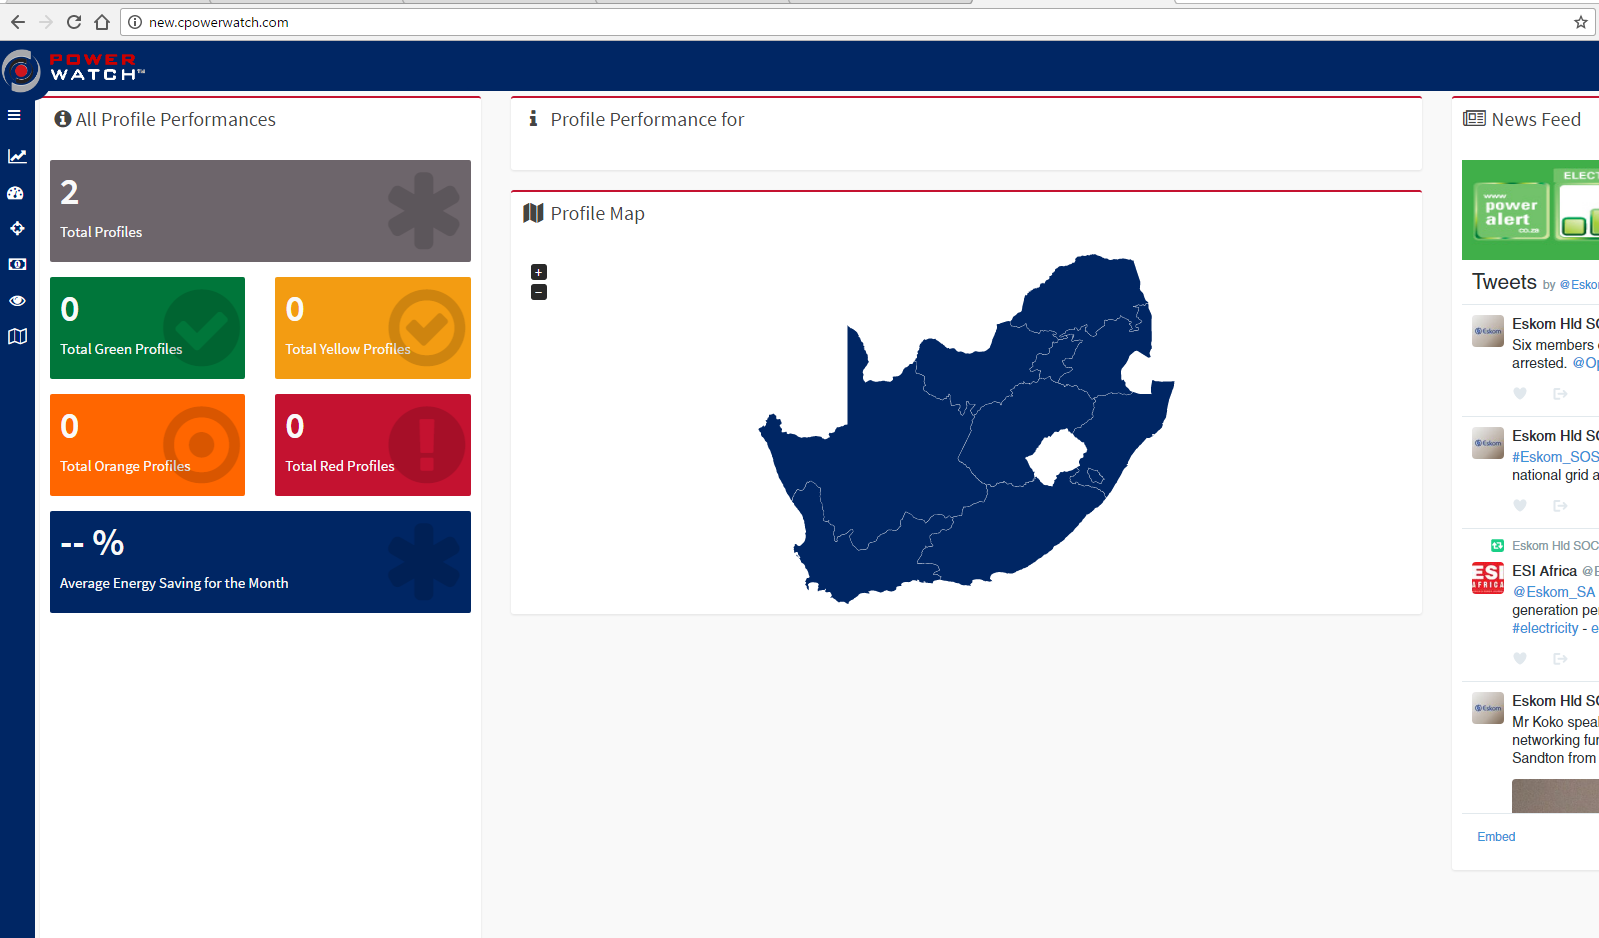
The blue band on the left-hand side contains the functionality for your site. If you hover over the symbols, text will appear indicating the function for that button.
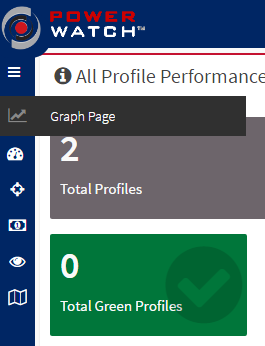
 Click on the “Graph Page” button to view near-real time graphs of your system.
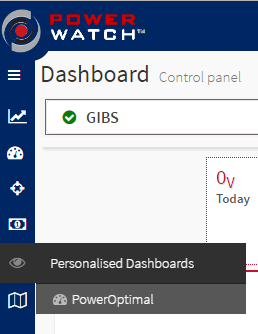
Click on the “Personalised Dashboard – PowerOptimal” button to view a dashboard of system performance.

2.3 How to view & interpret graphs
Below is a screenshot of the graph page:
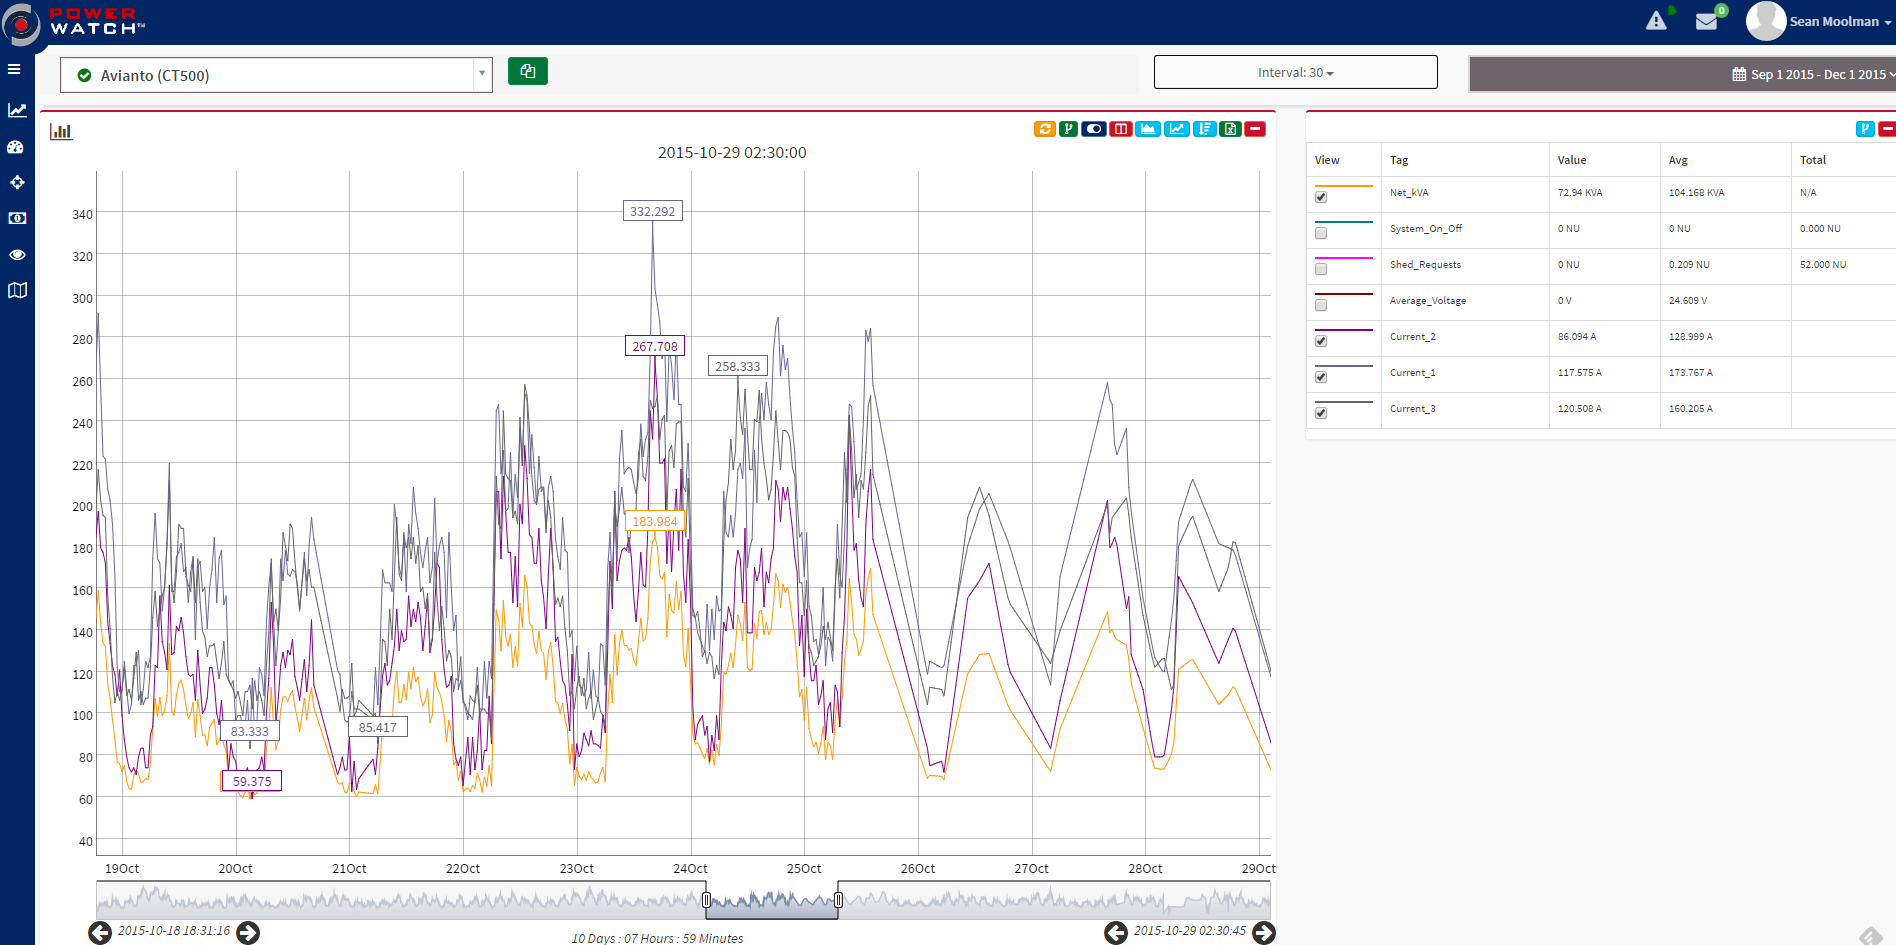
1. Select site
3. Select what data to display
2. Select date range
Select your site from the drop-down list;Select the date range that you want to view;Select the data that you want to display on the graph;You can navigate the graph in several ways. For example, you can hover over a data point to see the values at that time. You can select a date range on the graph itself by clicking anywhere on the graph and keeping the mouse button pressed whilst moving the mouse horizontally across the graph. You can also drag the bottom date selection left and right to view other / different dates.
2.4 How to view & interpret the dashboard
Below is a screenshot of the dashboard page:
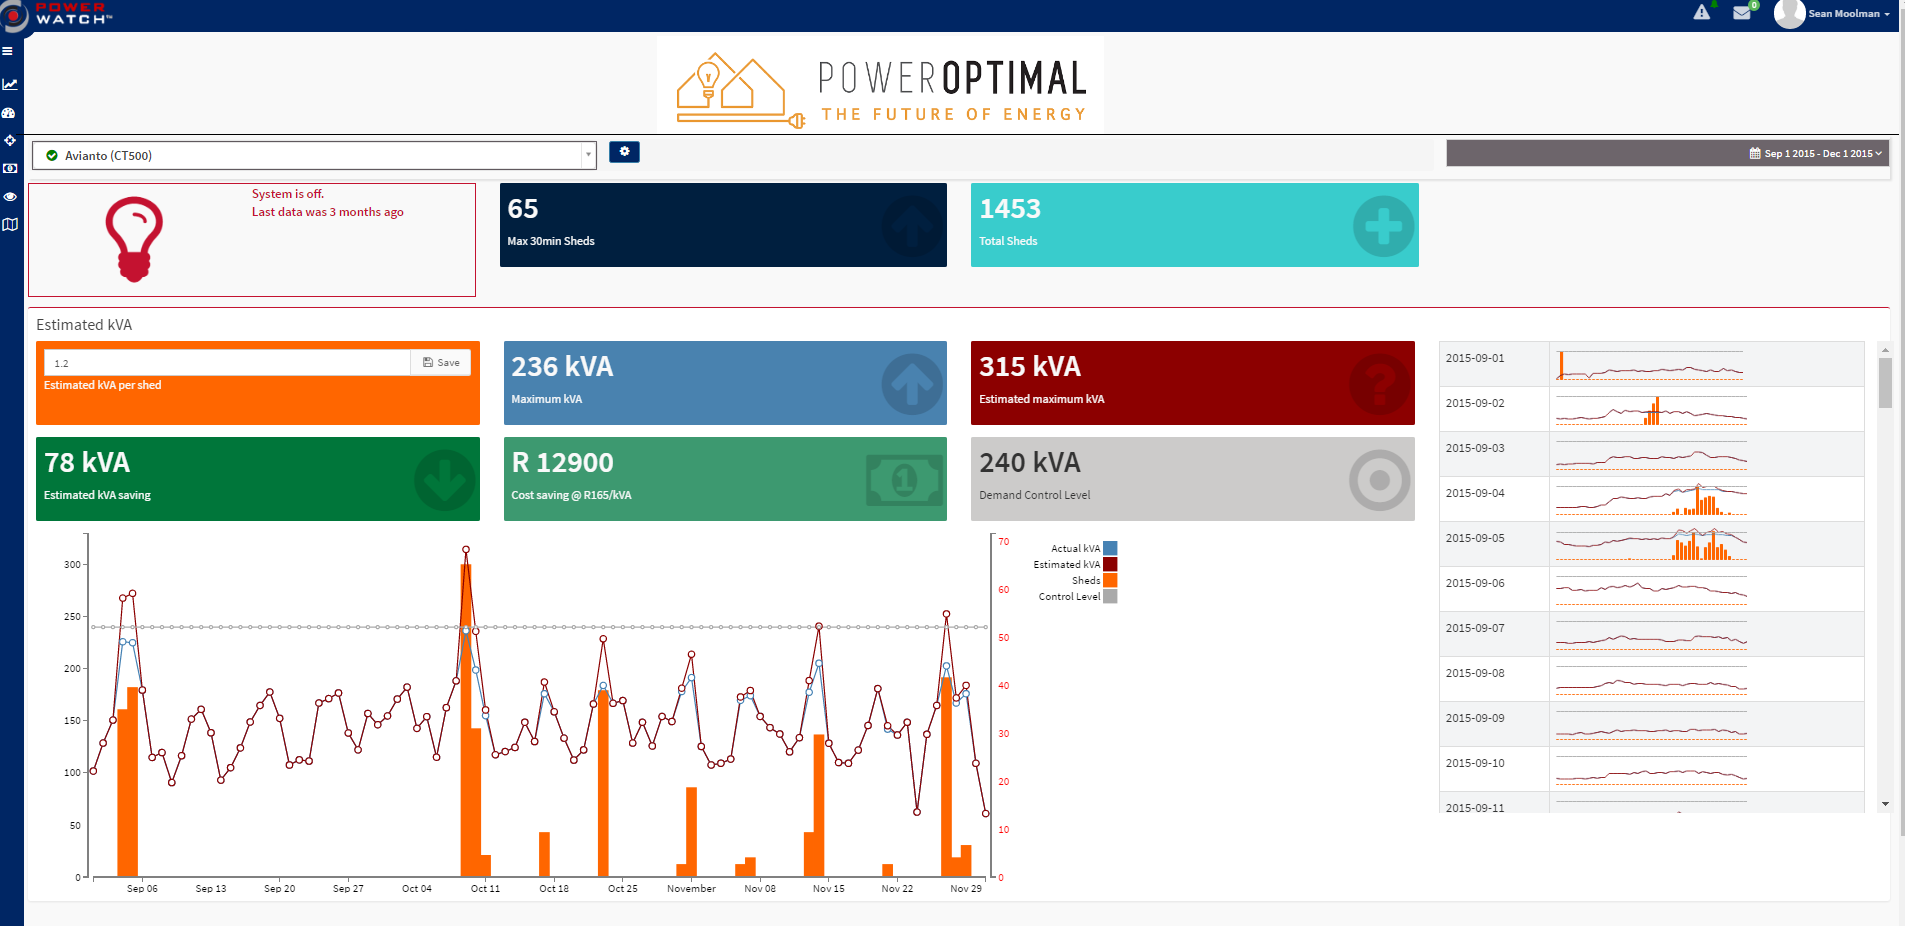
2. Select date range
5. Summary data on maximum demand
4. Graph of peak demand and shed requests
3. 24-hour (daily) demand profiles
1. Select site
Select your site from the drop-down list;Select the date range that you want to view;You can see a set of 24-hour demand profiles and shed requests on the right-hand side.Bottom left is the graph for the selected date range, showing the highest number of sheds in a 30-minute period for the day, as well as the highest demand (in kVA) for the day.The boxes in the middle indicate the maximum kVA and estimated savings for the selected date range. (Note:maximum demand charge is applied once per billing period, so to see the estimated savings for a specific billing period, use the start and end date of that billing period as the date range.)
Below is a close-up of the above graph:
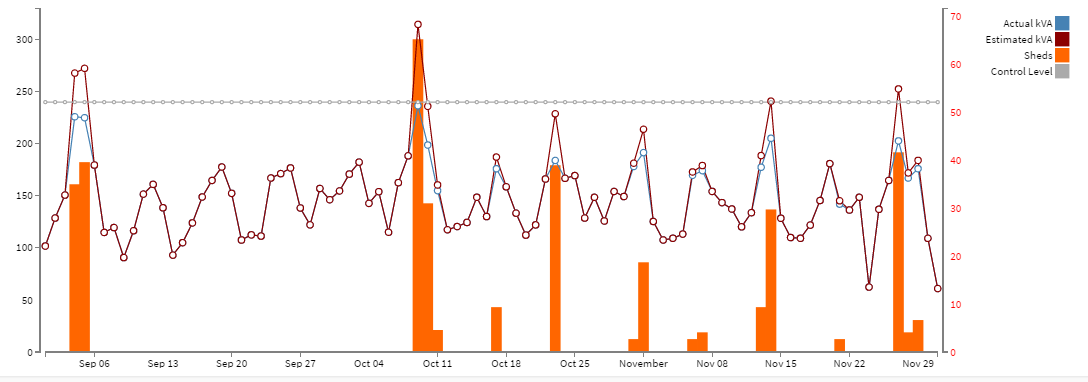
The orange columns indicate the highest number of shed requests in any 30 minute period on the specific date (with values on the right vertical axis), whilst the lines indicate the highest actual (blue) and estimated (dark red) kVA values for the specific date. The grey horizontal line indicates the control level of the PowerGuard unit.
You can hover over the graph to see specific values.
This graph and the small daily graphs on the right makes it easy to see the functioning of the PowerGuard system and provides a ready overview of the total demand of your facility. As the total demand approaches the peak demand level, the system starts to shed in order to maintain overall demand below the peak level.
The difference between the “Actual kVA” and “Estimated kVA” lines is the estimated kVA reduction achieved by the PowerGuard system on that day.
2.5 Estimated monthly savings
You can use the PowerOptimal Dashboard (discussed in Section 2.3) to obtain an estimate of the monthly savings achieved through the use of PowerGuard.
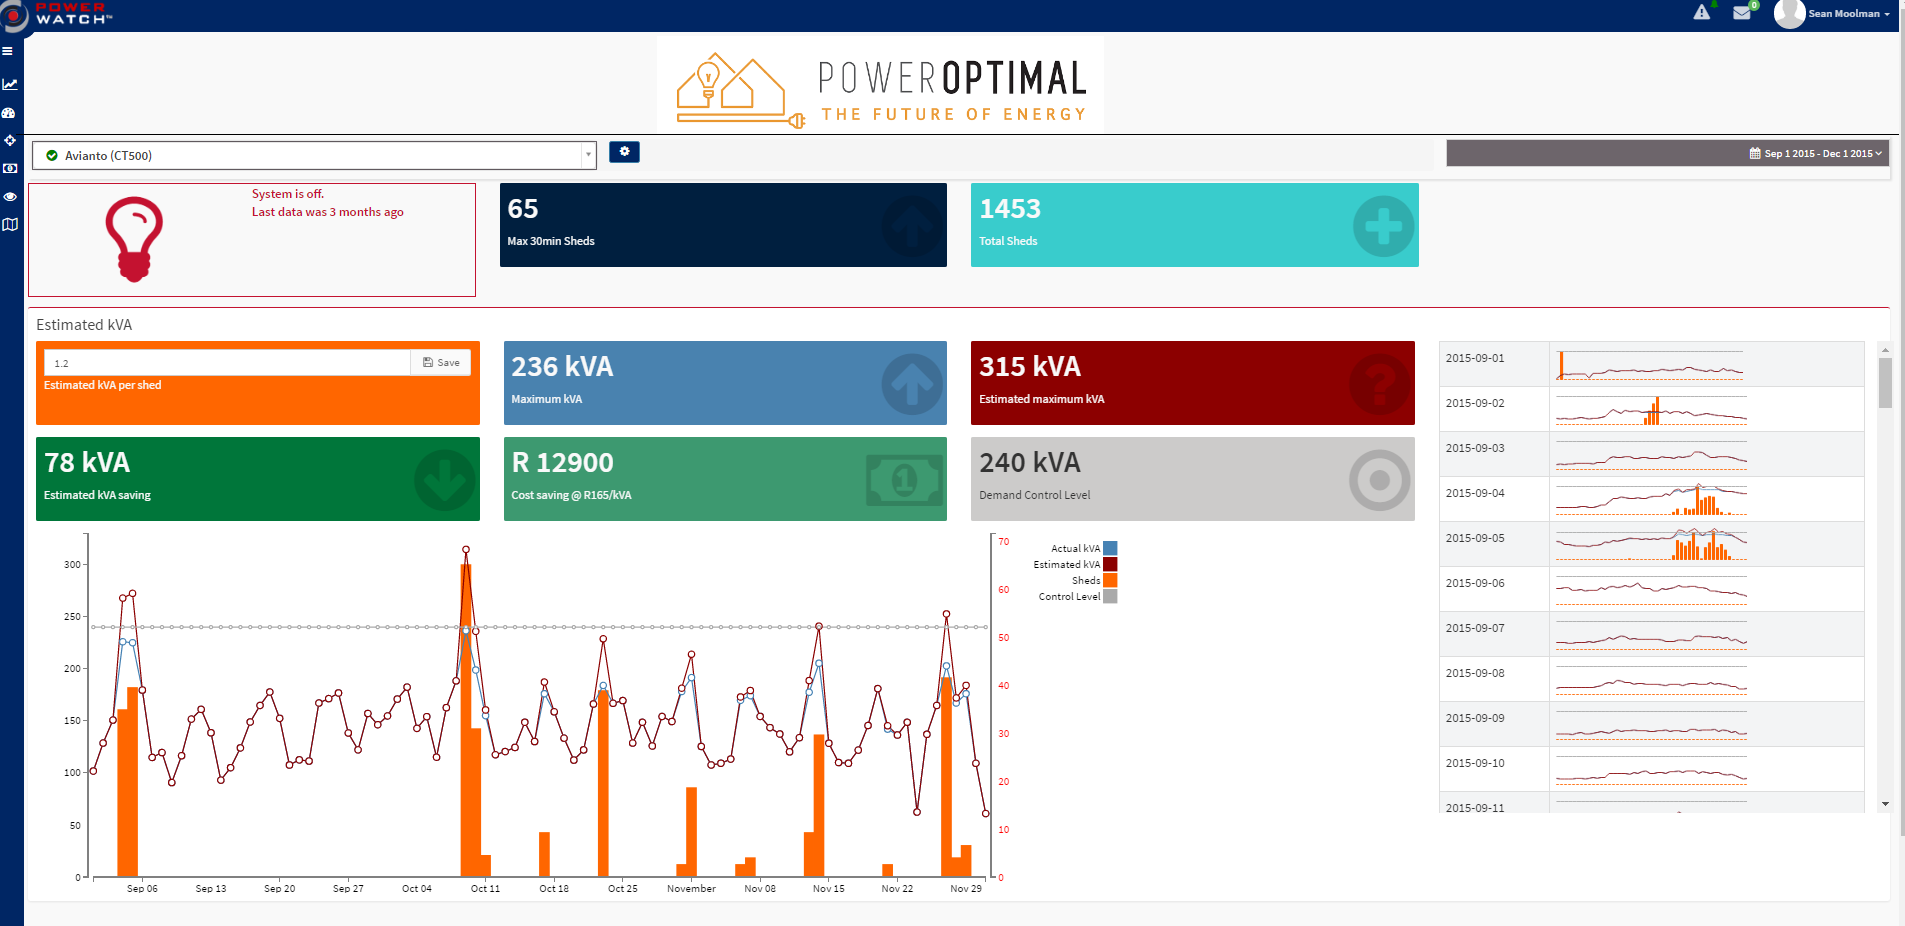
4. Estimated kVA & financial savings for the month / billing period
3. Select date range
2. Estimated kVA reduction per shed
1. Site setup
Click on the gear icon and check that the data is correctly configured for your site:
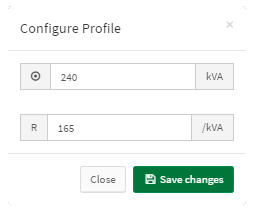
The demand charge tariff that you are being charged by Eskom or your municipality
The maximum demand level that the PowerGuard system is controlling your site at
Check the estimated kVA reduction per shed request for your site.Note:This value is configured by PowerOptimal during the initial commissioning and calibration of the system. You don’t need to change this number.Set the date range that you wish to look at (you should preferably set the date range to coincide with the billing date range on your electricity bill).Now you can read off the estimated savings in kVA and rands for the specific date range (billing period)!
3. Basic troubleshooting
Below is a table with basic troubleshooting tips. If you cannot resolve the problem using the below table, please contact your electrician or give us a call!
|
|
|
|
|
|
|
|
|
|
|
|
|
| |
|
|
|
Troubleshooting the online monitoring graphs
|
|
|
|
|
|
|
|
|
|
|
|
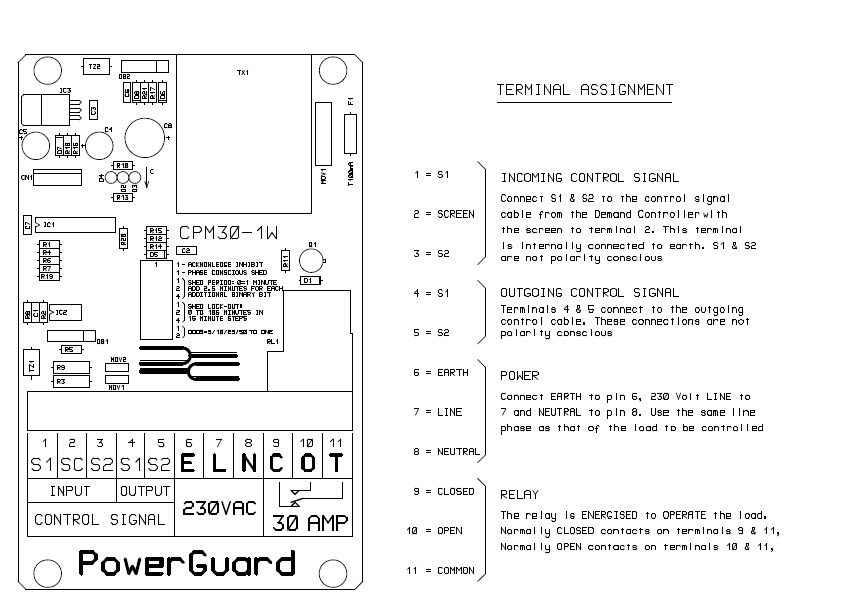
Appendix A. Front face of PowerGuard CPM30-1W Single Channel Receiver
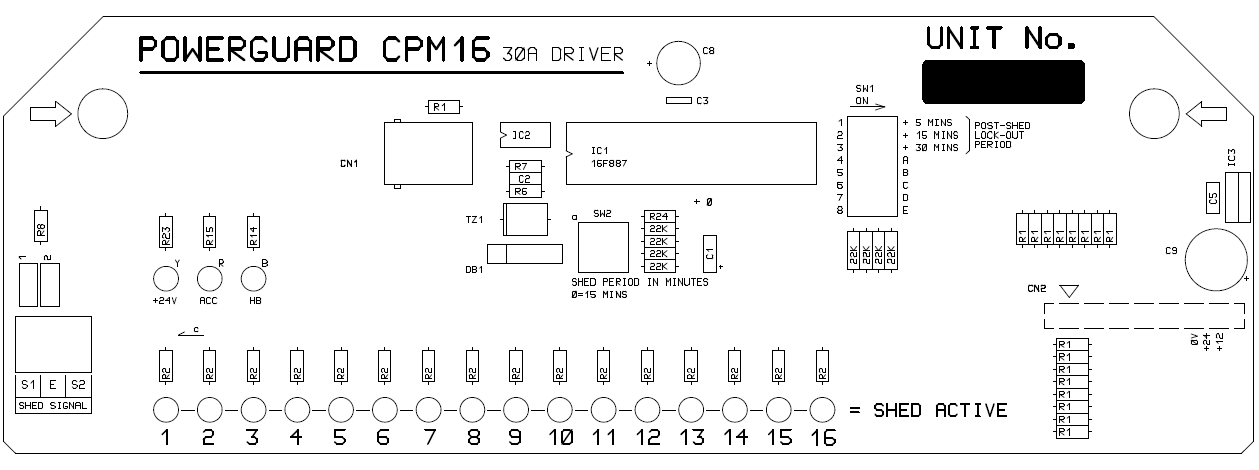
Appendix B. Front face of CPM16-30 16-Channel Receiver