
PowerOptimal Elon® 100 specification V2.20
INTRODUCING THE
PowerOptimal Elon® 100
The innovative PowerOptimal Elon® 100 incorporates proprietary solar PV (photovoltaic) power management technology to allow for direct connection of solar PV arrays to electric geysers (water heaters) with optimised solar power use in a single compact unit. The system can be connected to the grid (AC mains) as well, and intelligently switches between AC and solar power supply. The system requires no inverter and no battery. It can be connected to standard AC geyser heating elements and AC thermostats, which translates into the most cost-effective solar water heating option today.
Document Version: 2.20
SPECIFICATIONS
Rated input voltage
250V AC, 250V DC
Rated input current
25A AC, 20A DC
Mains (AC) voltage range (over-voltage & undervoltage protection)
-50% to +100%. Overvoltage protection up to 500V and undervoltage protection down to 125V. Will disconnect all loads when breach is greater than +/- 15%.
System power supply
Solar or 230V AC mains
Power consumption
<3W on mains power; <0.5W on solar power
Shutdown
Sufficient power supply capacity to manage processor, switching and data storage if both mains and solar supply fail
Solar voltage (Voc at STC)
20 – 250 V DC
Solar power availability sensing
Automatically determines availability of sufficient solar power before supplying load from solar PV array
Controller settings
Can be adjusted to run from “solar only” (100% solar energy use) to “mains only” (no solar energy use) with 3 settings in between to allocate different proportions of the day to solar and mains.
Thermostat
Uses the standard thermostat switch associated with the geyser element as a sensor only, with less than 10mA sense current, to control power to the element
Reverse polarity protection
Protected against reverse connection of solar array
Enclosure ingress protection rating
Elon 100 main unit: IP65
Elon 100 remote control: IP40 (install indoors or in waterproof enclosure)
Max. distance Elon® unit to controller
10 m (can be extended)
Annual energy production compared to inverter-based system
> 90% when solar array and geyser element are matched correctly
Standards conformance
IEC / SANS 60669-1, 60669-2-1, 60730-1, 60335-1, 60335-2-21, CISPR 11 & IEC 61000-6-1
Dimensions & weight
Elon® 100 main unit: 200 x 150 x 90 mm (LxWxH), 1.75 kg. Controller: 50 x 72 x 41 mm (LxWxH)
Box information (for shipping): 230 x 150 x 150 mm (LxWxH), 2 kg.
Patents
ZA 2019/02129
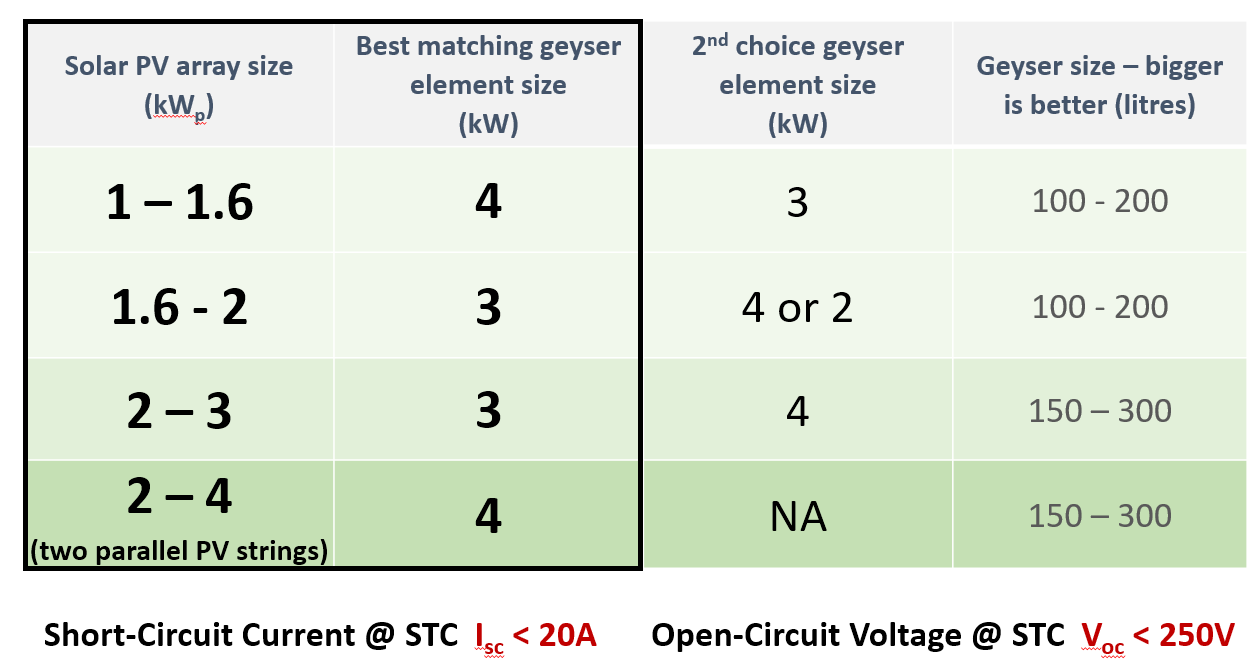
It is important to match the solar PV array and heating elements for maximum power transfer efficiency. See Table 1B for the recommended AC heating element power rating for different solar panel specifications and configurations.
Contact PowerOptimal for advice on module-element matching if module properties are significantly different to typical values or for bifacial, high current or high voltage modules.
TABLE 1A. ELON® KIT EASY SELECTION GUIDE – HOW MANY SOLAR PV MODULES DO I NEED?
The below table provides an easy selection guide based on number of people in the household and/or hot water use (showers/day). Minimum recommended array size is 1 kWp. More detailed information and selection guidelines are provided in Tables 2-7.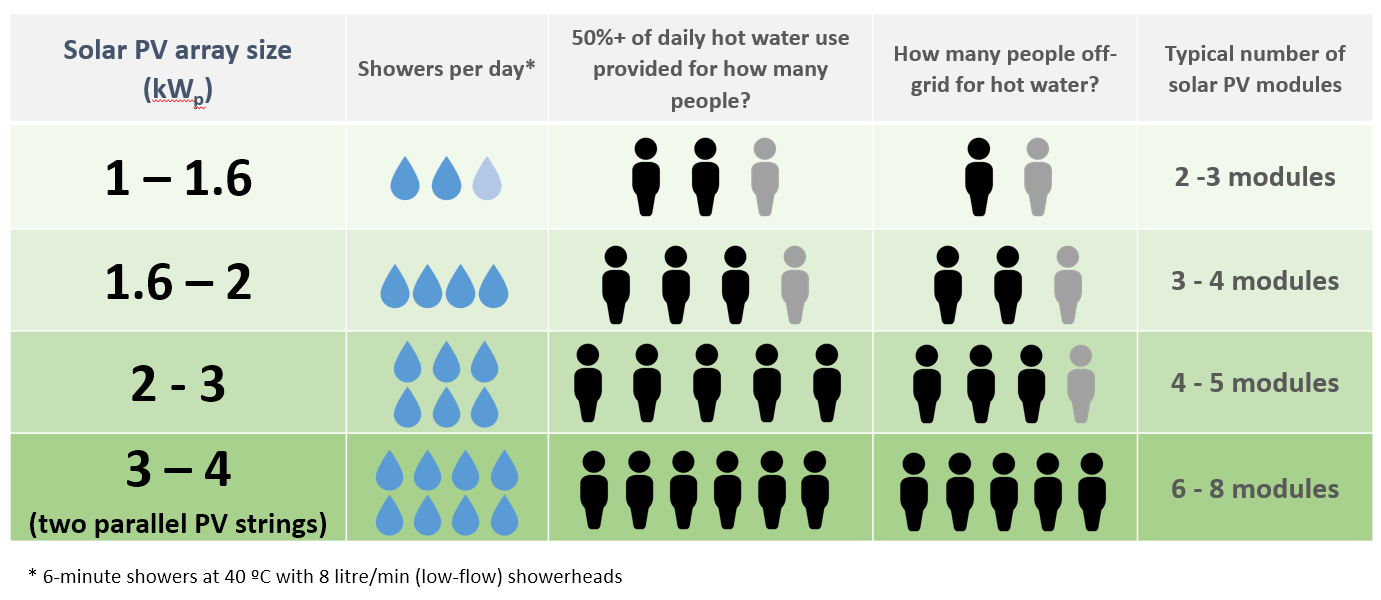
|
|
|
|
|
|
| |||
|
| |||
|
|
| ||
|
|
|
| |
|
|
|
* 6-minute showers at 40 °C with 8 litre/min (low-flow) showerheads
TABLE 1B. ELON® KIT EASY SELECTION GUIDE – WHAT SIZE GEYSER ELEMENT IS THE BEST MATCH?
To get the best performance from your Elon® solar PV water heater, it is important that the geyser element is a good match for the size of your solar PV array. This table helps you match the size of the solar PV array with the size of the geyser element.
|
|
|
|
|
|
|
|
|
|
|
|
|
|
|
|
|
|
|
|
* Second-choice element size would reduce efficiency by 10 – 20%.
Maximum allowed solar PV array specifications at Standard Test Conditions (STC):
Isc < 20A Voc < 250V Power < 4 kWp
TABLE 2. ANNUAL AVERAGE LITRES OF WATER HEATED PER DAY
The below example table indicates the average number of litres of water per day that the system will heat from 15 to 60 °C over a year period for different solar array peak power ratings. (The amount of water heated will vary with weather conditions, by geographic location and by season. Water heated per day will be significantly lower in winter and significantly higher in summer. These numbers indicate heating capacity – i.e. if no hot water is used on a given day, there will be less water heated on that day. This is only an approximate guide.)
Solar + Elon®
Annual average litres of water heated per day for X kWp installed solar capacity
Location
kWh/kWp/yr
0.8 kWp
1 kWp
1.2 kWp
1.4 kWp
1.6 kWp
1.8 kWp
2 kWp
2.5 kWp
3 kWp
3.5 kWp
Bloemfontein
1894
80
99
119
139
159
179
199
249
298
348
Cape Town
1624
68
85
102
119
136
154
171
213
256
299
Durban
1447
61
76
91
106
122
137
152
190
228
266
Jhb/Pretoria
1724
72
91
109
127
145
163
181
226
272
317
Mbombela
1627
68
85
103
120
137
154
171
214
256
299
Port Elizabeth
1565
66
82
99
115
132
148
164
205
247
288
Upington
1912
80
100
121
141
161
181
201
251
301
352
Saldanha
1623
68
85
102
119
136
153
170
213
256
298
Example:
For a solar PV array of 1.2 kWp, an installation in Johannesburg would yield about 1724 kWh/kWp/yr, or 1724 x 1.2 kWp = 2069 kWh/yr. This would be sufficient to heat on average 109 litres of water per day. For a family of 2 each using 80 litres of hot water per day, this would provide about 109 ÷ (80 x 2) or 68% of the annual hot water requirement.
TABLE 3. ANNUAL AVERAGE NUMBER OF SHOWERS PER DAY
The below table indicates the average number of showers per day for which the system will supply hot water over a year period for different solar array peak power ratings. (The amount of water heated will vary with weather conditions, by geographic location and by season. Water heated per day will be significantly lower in winter and significantly higher in summer. These numbers indicate heating capacity – i.e. if no hot water is used on a given day, there will be less water heated on that day. This is only an approximate guide.)
Solar + Elon®
Number of showers per day (based on annual average) for X kWp installed solar capacity
Location
kWh/kWp/yr
0.8 kWp
1 kWp
1.2 kWp
1.4 kWp
1.6 kWp
1.8 kWp
2 kWp
2.5 kWp
3 kWp
3.5 kWp
Bloemfontein
1894
2.4
3.0
3.6
4.2
4.8
5.4
6.0
7.5
9.0
10.4
Cape Town
1624
2.0
2.6
3.1
3.6
4.1
4.6
5.1
6.4
7.7
9.0
Durban
1447
1.8
2.3
2.7
3.2
3.6
4.1
4.6
5.7
6.8
8.0
Jhb/Pretoria
1724
2.2
2.7
3.3
3.8
4.3
4.9
5.4
6.8
8.2
9.5
Mbombela
1627
2.1
2.6
3.1
3.6
4.1
4.6
5.1
6.4
7.7
9.0
Port Elizabeth
1565
2.0
2.5
3.0
3.5
3.9
4.4
4.9
6.2
7.4
8.6
Upington
1912
2.4
3.0
3.6
4.2
4.8
5.4
6.0
7.5
9.0
10.5
Saldanha
1623
2.0
2.6
3.1
3.6
4.1
4.6
5.1
6.4
7.7
9.0
The table is based on 6-minute showers at 40 °C and 8 litres/min low flow showerheads. Old showerheads can use up to 15 litres/min and would substantially reduce the number of showers.
Example:
For a solar PV array of 2.5 kWp, an installation in Johannesburg would yield about 1724 kWh/kWp/yr, or 1724 x 2.5 kWp = 4 310 kWh/yr. This would be sufficient for about 6 to 7 showers per day.
TABLE 4. PERCENTAGE OF ANNUAL HOT WATER REQUIREMENT
The below example table indicates what % of the annual hot water requirement will on average be supplied by the system for 2 people each using 80 litres of hot (60 °C) water per day. (The amount of water heated will vary with weather conditions, by geographic location and by season. Water heated per day will be significantly lower in winter and significantly higher in summer. These numbers indicate heating capacity – i.e. if no hot water is used on a given day, there will be less water heated on that day. This is only an approximate guide.)
Solar + Elon®
Annual average % of hot water requirement supplied for 2 people each using 80 litres of hot water per day for X kWp installed solar capacity
Location
kWh/kWp/yr
0.8 kWp
1 kWp
1.2 kWp
1.4 kWp
1.6 kWp
1.8 kWp
2 kWp
2.5 kWp
3 kWp
3.5 kWp
Bloemfontein
1894
50%
62%
75%
87%
99%
112%
124%
155%
187%
218%
Cape Town
1624
43%
53%
64%
75%
85%
96%
107%
133%
160%
187%
Durban
1447
38%
47%
57%
66%
76%
85%
95%
119%
142%
166%
Jhb/Pretoria
1724
45%
57%
68%
79%
91%
102%
113%
142%
170%
198%
Nelspruit
1627
43%
53%
64%
75%
85%
96%
107%
134%
160%
187%
Port Elizabeth
1565
41%
51%
62%
72%
82%
92%
103%
128%
154%
180%
Upington
1912
50%
63%
75%
88%
100%
113%
126%
157%
188%
220%
Saldanha
1623
43%
53%
64%
75%
85%
96%
107%
133%
160%
186%
Examples:
An array of 1.2 kWp will provide approximately 64% of the annual hot water requirement for a family of two people in Cape Town.
An array of 2 kWp will provide approximately 124% x (2 / 4) = 62% of the annual hot water requirement for a family of four people in Bloemfontein.
TABLE 5. PEAK POWER OUTPUT FOR VARIOUS SOLAR MODULES AND ARRAY SIZES
The peak power production (Wp) of the modules at STC (Standard Test Conditions: irradiance 1000 W/m², spectrum AM 1.5, module temperature 25 °C) and at NOCT (Nominal Operating Cell Temperature, irradiance 800 W/m², spectrum AM 1.5, module temperature ~43 – 45 °C) are provided by the solar PV module manufacturer. The below table indicates the peak power at STC for a range of solar module power ratings and array sizes.
No. of cells per module
Module STC power rating (Wp)
Total peak power at STC in kWp for an array of X modules
3
modules
4 modules
5 modules
6 modules
8 (2 x 4) modules
10 (2 x 5) modules
12 (2 x 6) modules
60 or 120
265
0.795
1.06
1.325
1.59
2.12
2.65
3.18
60 or 120
270
0.81
1.08
1.35
1.62
2.16
2.70
3.24
60 or 120
275
0.825
1.10
1.375
1.65
2.20
2.75
3.30
60 or 120
280
0.84
1.12
1.40
1.68
2.24
2.80
3.36
60 or 120
285
0.855
1.14
1.425
1.71
2.28
2.85
3.42
60 or 120
290
0.87
1.16
1.45
1.74
2.32
2.90
3.48
60 or 120
295
0.885
1.18
1.475
1.77
2.36
2.95
3.54
60 or 120
300
0.90
1.20
1.50
1.80
2.40
3.00
3.60
60 or 120
305
0.915
1.22
1.525
1.83
2.44
3.05
3.66
60 or 120
310
0.93
1.24
1.55
1.86
2.48
3.1
3.72
60 or 120
315
0.945
1.26
1.575
1.89
2.52
3.15
3.78
60 or 120
320
0.96
1.28
1.6
1.92
2.56
3.2
3.84
60 or 120
325
0.975
1.3
1.625
1.95
2.6
3.25
3.9
60 or 120
330
0.99
1.32
1.65
1.98
2.64
3.3
3.96
72 or 144
310
0.93
1.24
1.55
1.86
2.48
3.10
3.72
72 or 144
315
0.945
1.26
1.575
1.89
2.52
3.15
3.78
72 or 144
320
0.96
1.28
1.60
1.92
2.56
3.20
3.84
NOT ALLOWED
(exceeds maximum rated Elon® 100 voltage)
72 or 144
325
0.975
1.30
1.625
1.95
2.60
3.25
3.90
72 or 144
330
0.99
1.32
1.65
1.98
2.64
3.30
3.96
72 or 144
335
1.005
1.34
1.675
2.01
2.68
3.35
4.02
72 or 144
340
1.02
1.36
1.70
NOT ALLOWED
(exceeds maximum rated Elon® 100 voltage)
2.04
2.72
3.40
4.08
72 or 144
345
1.035
1.38
1.725
2.07
2.76
3.45
4.14
72 or 144
350
1.05
1.40
1.75
2.10
2.80
3.50
4.20
72 or 144
355
1.065
1.42
1.775
2.13
2.84
3.55
4.26
72 or 144
360
1.08
1.44
1.8
2.16
2.88
3.6
4.32
72 or 144
365
1.095
1.46
1.825
2.19
2.92
3.65
4.38
72 or 144
370
1.11
1.48
1.85
2.22
2.96
3.7
4.44
72 or 144
375
1.125
1.5
1.875
2.25
3
3.75
4.5
72 or 144
380
1.14
1.52
1.9
2.28
3.04
3.8
4.56
72 or 144
385
1.155
1.54
1.925
2.31
3.08
3.85
4.62
72 or 144
390
1.17
1.56
1.95
2.34
3.12
3.9
4.68
72 or 144
395
1.185
1.58
1.975
2.37
3.16
3.95
4.74
72 or 144
400
1.2
1.6
2
2.4
3.2
4
4.8
72 or 144
405
1.215
1.62
2.025
2.43
3.24
4.05
4.86
72 or 144
410
1.23
1.64
2.05
2.46
3.28
4.1
4.92
72 or 144
415
1.245
1.66
2.075
2.49
NOT ALLOWED
(exceeds maximum rated Elon® 100 voltage)
3.32
4.15
4.98
72 or 144
420
1.26
1.68
2.1
2.52
3.36
4.2
5.04
NOT ALLOWED
(exceeds maximum rated Elon® 100 voltage)
72 or 144
425
1.275
1.7
2.125
2.55
3.4
4.25
5.1
72 or 144
430
1.29
1.72
2.15
2.58
3.44
4.3
NOT ALLOWED
(exceeds maximum Elon® 100 power rating)
5.16
72 or 144
435
1.305
1.74
2.175
2.61
3.48
4.35
5.22
72 or 144
440
1.32
1.76
2.2
2.64
3.52
4.4
5.28
72 or 144
445
1.335
1.78
2.225
2.67
3.56
4.45
5.34
72 or 144
450
1.35
1.8
2.25
2.7
3.6
4.5
5.4
72 or 144
455
1.365
1.82
2.275
2.73
3.64
4.55
5.46
Examples:
An array of 4 x 325 Wp modules in series will have a total peak power (at STC) of 1.3 kWp.
An array of 2 parallel strings of 5 modules of 280 Wp each (10 modules of 280 Wp in total) will have a total peak power (at STC) of 2.8 kWp.